RouteWave User Guide
Everything you need to go from download to full waveform analysis. This guide follows the natural workflow: install, explore the UI, navigate your signals, and progressively unlock the analysis tools.
Get Running
One command installs the RouteRTL SDK and launches RouteWave. The binary is auto-downloaded on first use — no manual setup.
Install
rr ws update-viewer or pip install --upgrade routertl.First Launch
Open RouteWave with a waveform file to jump straight into analysis. It accepts VCD, FST, GHW, and ILA CSV formats.
At launch, the Signal Hierarchy panel loads the full design tree. Double-click any signal to add it to the waveform view.
WSL2 (Windows)
RouteWave runs natively on WSL2. A fresh Ubuntu install needs OpenGL libraries first — one line, then you're set.
xeyes — if a window appears, RouteWave will work. If not, run wsl --updateand check you're on WSL2 (wsl -l -v).The Layout
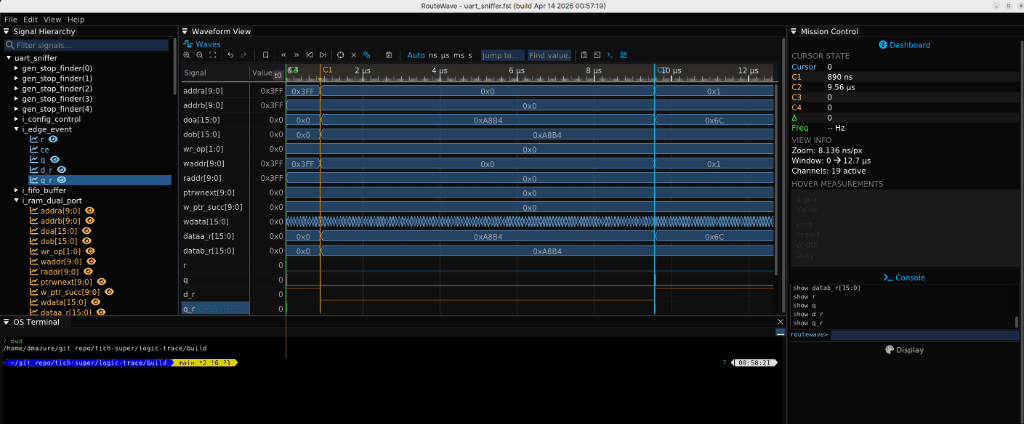
RouteWave has four main panels. Understanding where things live will make everything else in this guide click.
Signal Hierarchy
The left panel shows your entire design tree. Modules are expandable folders; signals are leaf nodes with coloured eye badges. Double-click a signal to add it to the waveform view. The eye badge turns bright blue when a signal is currently displayed.
Waveform View
The center canvas renders your signals at 60 FPS using GPU-accelerated rendering. Each signal occupies a horizontal row with its name and current value on the left. Bus signals display as diamond-shaped lozenges with their hex value inside.
The timeline ruler at the top shows time ticks with auto-scaling units (ns, μs, ms, s). Use the unit selector in the toolbar to force a specific unit.
Mission Control
The right panel provides live context about your current view:
- Cursor State — positions and delta of all active cursors
- View Info — zoom level, time window, active channel count
- Hover Measurements — signal name, value, frequency, period, width, and duty cycle at the mouse position
- Display — rendering settings and visual options
Console
The bottom panel is a scriptable command console. Focus it with Ctrl+J. Every action in RouteWave — adding signals, changing views, attaching decoders — can be done through the console. This makes RouteWave fully automatable.
Work with Signals
RouteWave goes beyond simple signal viewing — you can create virtual buses, search for values, and group related signals together.
Add & Remove
There are multiple ways to add signals to the waveform view:
- Double-click a signal in the hierarchy tree
- Use the console:
show clk,show data[7:0] - Use Ctrl+F to search and add
To remove a signal, right-click it in the waveform and select "Hide", or use hide signalname in the console.
Reorder & Group
Drag and drop signals in the waveform view to reorder them. You can also create visual groups to separate related signals with dividers and labels.
Change Radix
Bus signals default to hexadecimal display. Change the display radix using keyboard shortcuts or the console:
| shortcut | action |
|---|---|
| 1 | Hexadecimal (default) |
| 2 | Decimal |
| 3 | Binary |
| 4 | ASCII |
Select a signal first, then press the number key. ASCII mode is particularly useful for UART data buses where you want to see the transmitted characters directly on the waveform.
Virtual Buses
Combine individual signals into a virtual bus for grouped analysis:
Virtual buses appear in the waveform just like real bus signals — with lozenges showing the combined hex value. They persist across sessions when saved in a .ltrace session file.
Find Values
Search a bus signal for a specific value — essential for tracking down a particular address access or data pattern:
You can also use the Find value button in the toolbar. Search results are highlighted on the timeline with small markers.
Analyze
RouteWave includes built-in analysis tools that let you decode protocols, measure timings, and compare waveforms — without leaving the viewer.
Measurements
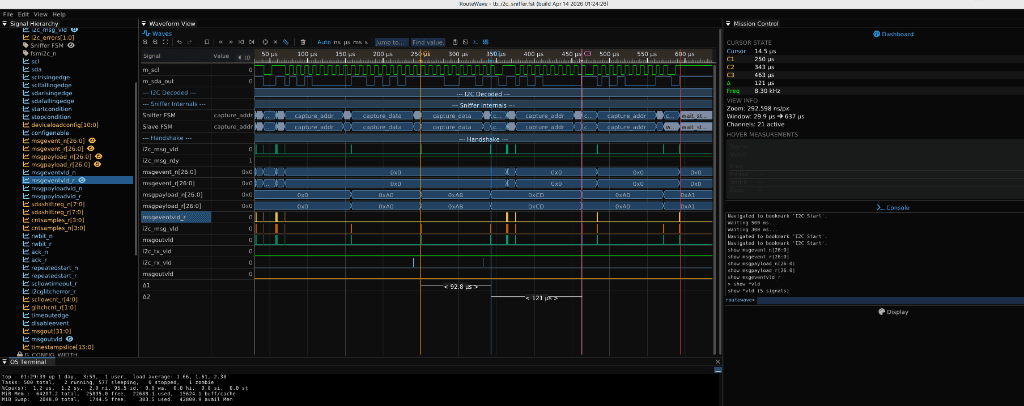
The measure command computes timing properties of a signal:
For quick hover measurements, just move your mouse over any signal. Mission Control updates live with the signal name, current value, and timing properties at the cursor position.
Handshake Analyzer
Bind a valid/ready pair to visualize handshake transfers as coloured overlay bands on the waveform:
Or press H with two signals selected. The handshake overlay appears as semi-transparent bands across the waveform, making protocol bottlenecks immediately visible.
Protocol Decoders
RouteWave includes built-in decoders for common serial protocols:
Decoded data appears as annotated labels directly on the waveform timeline. For UART, you'll see individual bytes with their ASCII representation.
Waveform Diff
Compare two simulation runs side-by-side to find the exact point where behaviour diverges:
Waveform Comparison
Compare two simulation runs to find where behaviour diverges. Load a reference file and use the compare command to overlay differences on individual signals:
Automate
Every action in RouteWave can be done through the console. This makes it fully scriptable — set up complex signal views once, save them as scripts, and replay instantly.
Console Commands
Open the console with Ctrl+T. Here are the most commonly used commands:
| command | description |
|---|---|
| show <signal> | Add signal to canvas |
| hide <signal> | Remove signal from canvas |
| zoom <in|out|fit|start end> | Zoom viewport |
| pan <start|end> | Pan to trace boundary |
| measure <signal> | Compute period/frequency/duty |
| handshake bind <valid> <ready> | Bind handshake overlay |
| translate <ch> uart_8n1 | Attach protocol decoder |
| compare load <file> | Load reference for diff |
| makebus <name> | Create virtual bus from selection |
| find <channel> <value> | Search for hex value on bus |
| bookmark [name] | Save viewport position |
| goto <name|time> | Jump to bookmark or timestamp |
| export <file.csv> | Export visible data |
| record start <file> / stop | Record command macro |
| help | Show all commands |
Macro Recording
Record a sequence of console commands to a .ltr file and replay them later:
Script Files
Save your setup as a script file (.ltr) and source it on startup. This is the power-user path to reproducible debugging sessions:
CSV Export
Export the visible waveform data to CSV for post-processing in Python, MATLAB, or spreadsheet tools:
Reference
Keyboard Shortcuts
| shortcut | action |
|---|---|
| Ctrl + O | Open file |
| Ctrl + Z / Ctrl + Y | Undo / Redo |
| Ctrl + P | Command palette |
| Ctrl + J | Focus console |
| + / - | Zoom in / out |
| F | Zoom to fit |
| Home / End | Pan to start / end |
| N / Shift + N | Next / previous edge |
| C | Push cursor |
| R | Create measurement ruler |
| B | Drop zoom bookmark |
| H | Bind handshake on selection |
| Z / Shift + Z | Zoom undo / redo |
| Scroll wheel | Zoom at cursor position |
File Formats
| format | description | source |
|---|---|---|
| VCD | IEEE 1364 Value Change Dump | Any Verilog/SV simulator |
| FST | Fast Signal Trace (compressed) | GTKWave-compatible tools |
| GHW | GHDL Waveform (native) | GHDL via libghw |
| ILA CSV | Integrated Logic Analyzer export | Vivado / Quartus |
| .ltrace | RouteWave native JSON session | RouteWave (save/load) |
CLI Flags
Memory Management
For large waveform files, RouteWave includes a compression engine using delta-varint timestamps and RLE values to reduce memory usage: